| Version | Upload Status | Downloads |
|---|---|---|
 |
 |
| Version | Upload Status | Size |
|---|---|---|
 |
 |
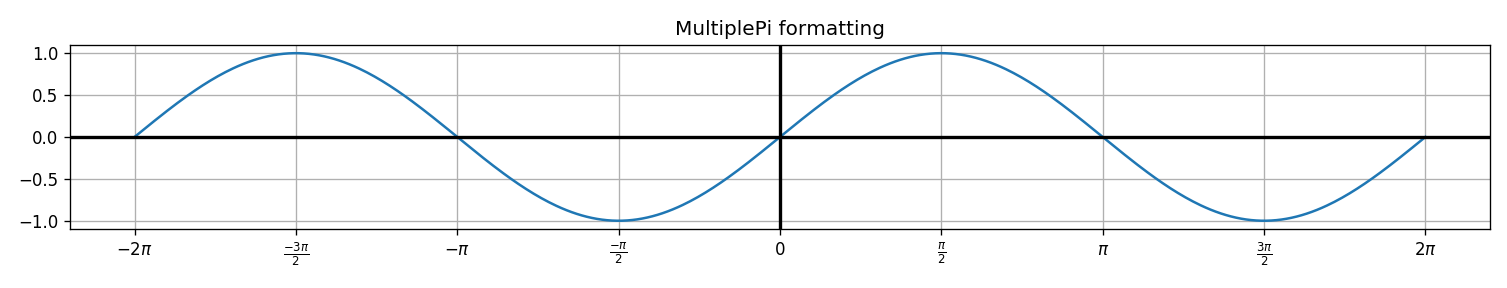
Format multiples of pi as strings on Matplotlib axes.
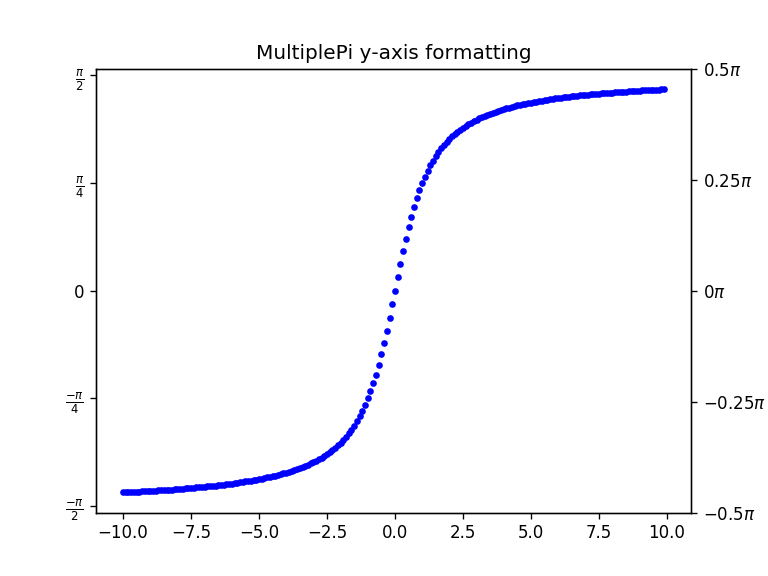
The MultiplePi class creates a Locator to place ticks at desired multiples and a Formatter to format all tick labels.
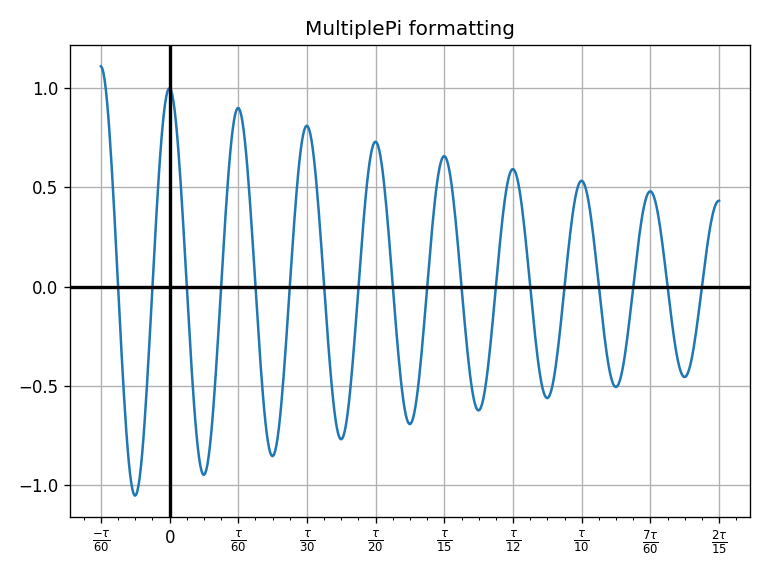
The base (π or τ) can be divided by any Natural Number.
Multiples of one-π or one-τ can be placed/formatted too. (2π, 3π, 2τ, 3τ, etc.)
pip install matplot-fmt-pifrom matplot_fmt_pi.ticker import MultiplePiSimply, the instance can be asssigned a denominator of pi then passed to matplotlib.
The parameters can also be modified to adjust the output to something more sophisticated.
Clone, then from the repo,
cd examples/
python *.py
Put the repo's directory in the python path to import the matplot_fmt_pi folder not the installed package.
PYTHONPATH=/home/user/py-pros/format-pi python examples/pi_graph.py- Add testing option once installed (Like
numpy.test()) - Windows
make.bat?

Inspired by this post on StackOverflow.