![]()


AI-powered visual debugging for React, Vue, Svelte, SolidJS, Preact & Next.js via MCP and ACP.
DevInspector connects your web app directly to your AI agent. Click any element to instantly send its source code, style, and network context to the AI for analysis and fixing.
Works with any MCP-compatible AI client. Supports ACP agents: Claude Code, Codex CLI, Gemini CLI, OpenCode, and more.
- Demo Video
- Key Features
- Quick Start
- Framework Support
- Configuration
- How It Works
- Workflow Modes
- MCP Tools
- Architecture
👉 Watch the demo: https://www.youtube.com/shorts/TCt2oOtPS_k
🐦 Twittter/X Post: https://x.com/yaoandyan/status/1995082020431753600
- yaonyan - Project Creator
This project uses the following sponsor APIs and platforms:
- Anthropic - Claude API for MCP integration testing and AI-powered debugging capabilities
- Gradio -
@gradio/clientfor connecting to Gradio-powered APIs in the demo app
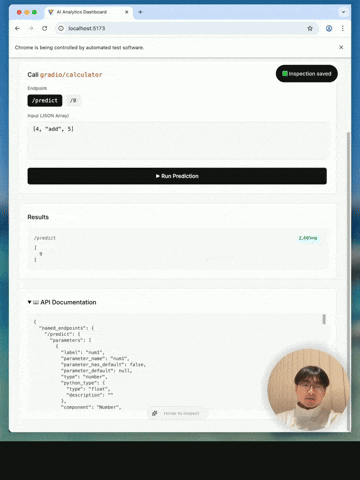
Click any element to instantly send its source code location, computed styles, and DOM hierarchy to AI. No more explaining "it's the blue button in the header".
AI can access Chrome DevTools to analyze network requests, console logs, and performance metrics. It sees what you see.
Switch between agents (Claude Code, Goose) and track their debugging progress visually with step-by-step status updates.
# npm
npm i -D @mcpc-tech/unplugin-dev-inspector-mcp

# pnpm
pnpm add -D @mcpc-tech/unplugin-dev-inspector-mcp

# yarn
yarn add -D @mcpc-tech/unplugin-dev-inspector-mcp
Add DevInspector to your project:
Run the setup command to automatically configure your vite.config.ts, webpack.config.js, or next.config.js:
npx @mcpc-tech/unplugin-dev-inspector-mcp setupOptions:
--dry-run- Preview changes without applying them--config <path>- Specify config file path (auto-detect by default)--bundler <type>- Specify bundler type: vite, webpack, nextjs--no-backup- Skip creating backup files--help- Show help message
Examples:
# Preview changes before applying
npx @mcpc-tech/unplugin-dev-inspector-mcp setup --dry-run

# Setup specific config file
npx @mcpc-tech/unplugin-dev-inspector-mcp setup --config vite.config.ts

# Setup for specific bundler
npx @mcpc-tech/unplugin-dev-inspector-mcp setup --bundler vite
This will:
- Detect your bundler configuration
- Add the necessary import
- Add the plugin to your configuration
- Create a backup of your config file
If you prefer to configure it manually:
// vite.config.ts
+import DevInspector from '@mcpc-tech/unplugin-dev-inspector-mcp';
 import react from '@vitejs/plugin-react'; // or vue(), svelte(), solid(), preact()

 export default {
   plugins: [
+    DevInspector.vite({
+      enabled: true,
       showInspectorBar: true, // Default: true. Set to false to hide the UI.
+      autoOpenBrowser: false, // Default: false. Automatically open browser when server starts.
     }),
     react(), // or vue(), svelte(), solid(), preact()
   ],
 };
⚠️ Plugin order matters: PlaceDevInspector.vite()beforereact(),vue(),svelte(),solid(), orpreact(). Otherwise source locations may showunknown:0:0.
If your project doesn't use HTML files (e.g., miniapp platforms that only bundle JS):
// vite.config.ts
DevInspector.vite({
  enabled: true,
  autoInject: false  // Disable HTML injection
})
// main.ts or app entry point
import 'virtual:dev-inspector-mcp'; // ← Add this import✅ Zero Production Impact: This import is automatically removed in production builds via tree-shaking. The entire dev-inspector code is wrapped in if (import.meta.env.DEV) guards, which bundlers statically replace with false during production builds.
If virtual:dev-inspector-mcp conflicts with your project, you can customize it:
// vite.config.ts
DevInspector.vite({
  enabled: true,
  autoInject: false,
  virtualModuleName: 'virtual:my-custom-inspector'  // ← Custom name
})
// main.ts
import 'virtual:my-custom-inspector'; // ← Use your custom name// webpack.config.js
+const DevInspector = require('@mcpc-tech/unplugin-dev-inspector-mcp');
module.exports = {
plugins: [
+ DevInspector.webpack({
+ enabled: true,
+ }),
],
};// next.config.ts
+import DevInspector from '@mcpc-tech/unplugin-dev-inspector-mcp';
const nextConfig: NextConfig = {
+ webpack: (config) => {
+ config.plugins.push(
+ DevInspector.webpack({
+ enabled: true,
+ })
+ );
+ return config;
+ },
};
export default nextConfig;Then add to your root layout:
// app/layout.tsx
import { DevInspector } from "@mcpc-tech/unplugin-dev-inspector-mcp/next";

export default function RootLayout({ children }) {
  return (
    <html>
      <body>
        <DevInspector />
        {children}
      </body>
    </html>
  );
}
💡 Note: Webpack and Next.js use a standalone server on port 8888. Run
next dev --webpackfor Webpack mode (Next.js 16+ defaults to Turbopack).
- React -
.jsxand.tsxfiles (Vite, Webpack, Next.js) - Vue -
.vuesingle-file components (Vite, Webpack) - Svelte -
.sveltecomponents (Vite, Webpack) - SolidJS -
.jsxand.tsxfiles (Vite, Webpack) - Preact -
.jsxand.tsxfiles (Vite, Webpack) - Next.js - React with Webpack mode
- Angular - Support coming soon
The plugin automatically updates MCP configuration files for detected editors when the dev server starts. This saves you from manually configuring MCP endpoints.
Supported editors: Cursor, VSCode, Windsurf, Claude Code, Antigravity
// vite.config.ts
DevInspector.vite({
  // Auto-detect and update (default: true)
  updateConfig: true,

  // Or specify editors manually
  updateConfig: ['cursor', 'vscode'],

  // Or disable
  updateConfig: false,

  // Server name in MCP config (default: 'dev-inspector')
  updateConfigServerName: 'my-app-inspector',
})
Custom editors: For non-standard editors, use customEditors:
DevInspector.vite({
  customEditors: [
    {
      id: 'my-editor',
      name: 'My Editor',
      configPath: '~/.my-editor',        // absolute, ~/relative, or project-relative
      configFileName: 'mcp.json',
      serverUrlKey: 'url',               // default: 'url'
      configFormat: 'mcpServers',        // 'mcpServers' or 'servers' (vscode-style)
    },
  ],
})This plugin uses the Agent Client Protocol (ACP) to connect with AI agents.
⏱️ Note: Initial connection may be slow as agents are launched via npx (downloads packages on first run).
Default agents: View configuration →
You can customize available AI agents and set a default agent:
// vite.config.ts
export default {
  plugins: [
    DevInspector.vite({
      enabled: true,
      // Custom agents (will be merged with default properties)
      agents: [
        {
          name: "Claude Code", // Matches default - auto-fills icon and env
          command: "npx",
          args: ["-y", "@zed-industries/claude-code-acp"],
        },
        {
          name: "My Custom Agent",
          command: "my-agent-cli",
          args: ["--mode", "acp"],
          env: [{ key: "MY_API_KEY", required: true }],
          meta: { icon: "https://example.com/icon.svg" }
        }
      ],
      // Set default agent to show on startup
      defaultAgent: "Claude Code"
    }),
  ],
};
Key Features:
- Custom agents with the same name as default agents automatically inherit missing properties (icons, env)
- You can override just the command/args while keeping default icons
- If no custom agents provided, defaults are: Claude Code, Codex CLI, Gemini CLI, Kimi CLI, Goose, OpenCode
Click element → Describe issue → AI analyzes → Get fix
- Click any UI element to capture context (source, styles, DOM)
- Describe what's wrong or ask a question about the element
- AI diagnoses using Chrome DevTools integration
- Get intelligent solutions through natural conversation
Examples:
- "Why is this button not clickable?" → AI checks
pointer-events, z-index, overlays - "This API call is failing" → AI analyzes network requests, timing, responses
- "Where is this component?" → Jump to source file and line number
DevInspector offers two ways to interact with your AI, depending on your preference:
Best for: Code-heavy tasks, refactoring, and maintaining flow.
- How it works: You use your IDE's AI assistant (Cursor, Windsurf, Copilot).
- The Flow: Click an element in the browser -> The context (source, props, styles) is sent to your Editor via MCP -> You ask your Editor to fix it.
- Why: Keeps you in your coding environment.
Best for: Quick fixes, visual tweaks, or if you don't use an AI editor.
- How it works: You use the floating "Inspector Bar" directly in the browser.
- The Flow: Click "Ask AI" in the browser -> Select an agent (e.g., Claude Code, Custom Script) -> The agent runs in your terminal but interacts with the browser overlay.
- Why: No context switching. Great for "what is this?" questions or network debugging.
Activates visual selector. Returns source location, DOM hierarchy, styles, dimensions, and user notes.
Shows all inspections with ID, element details, notes, and status (pending/in-progress/completed/failed).
Updates inspection status with optional progress steps.
Parameters: status, message (required for completed/failed), progress, inspectionId (optional)
Executes JavaScript in browser context. Access to window, document, React/Vue instances, localStorage.
Agentic tool for Chrome DevTools access. Provides network inspection, console logs, performance metrics, element interaction, and more.
Capture and analyze UI element context.
View all pending, in-progress, and completed inspections.
Opens Chrome with DevTools API. Unlocks network analysis, console logs, performance metrics.
Parameter: url (defaults to dev server)
💡 Optional if Chrome is already open. Use when you need to launch a new Chrome instance.
List network requests or get details of a specific one. Always refreshes the list first.
Parameter: reqid (optional) - If provided, get details for that request. If omitted, just list all requests.
List console messages or get details of a specific one. Always refreshes the list first.
Parameter: msgid (optional) - If provided, get details for that message. If omitted, just list all messages.
For a deep dive into how the MCP context, CMCP library, and Puppet binding mechanism work together, see the Architecture Documentation.
Key concepts:
- Hub-and-spoke model: Vite dev server acts as central hub managing multiple client connections
- CMCP bidirectional execution: Server defines tool schemas, browser client provides implementations
- Puppet binding: Enables Chrome DevTools ↔ Inspector message passthrough
- Dynamic rebinding: Automatic connection recovery after browser refresh
MIT