Raster created by AOOarea function is off of the original input #4
Description
Hi again,
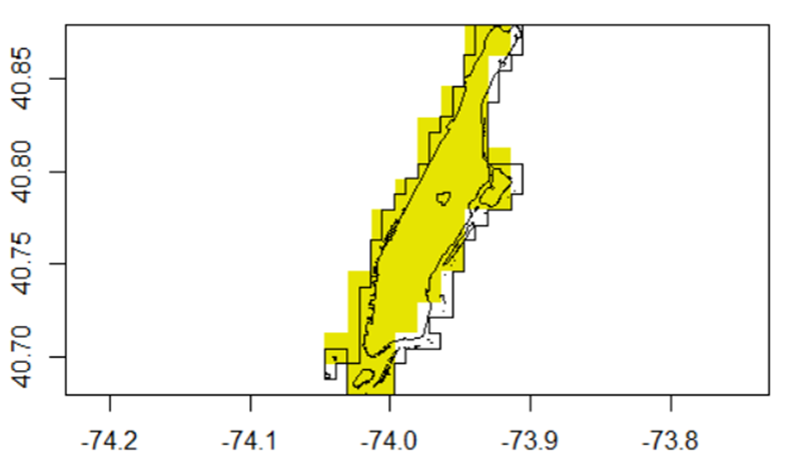
When using a raster as input for AOOraster, it looks like the created 1 arcmin is off of the original input data. My first guess is because of the internal use of the resample function, this is leaving some pixels out in the final output (which will affect the area calculation). I added a plot to make the issue clear. In yellow is the output raster, and in black lines is the 30 arcsec input raster (and the original polygon of Manhattan. In the end, you will find the code to get the plot.
If you want to select all pixels that “touch” the one arcmin template, one option is using the mask() function.
Feel free to let me know if you have any questions.
Best,
Gonzalo
library(tigris)
library(terra)
library(changeRangeR)
library(raster)

# Get Manhattan polygon
mh <- tigris::tracts(state = '36', county = '061')
mh <- tigris::erase_water(mh)
sf::sf_use_s2(FALSE)
mh <- sf::st_union(mh) %>% sf::st_buffer(dist = 0)
## To WGS 84
mh <- terra::project(terra::vect(mh), y = "EPSG:4326") %>%
  sf::st_as_sf()

### Create a raster based on manhattan polygon
rWGS84 <- rast(mhWGS84, res = 1/120)
values(rWGS84) <- 1
rWGS84 <- terra::mask(rWGS84, mhWGS84)
### Calculate area
crrWGS84 <- changeRangeR::AOOarea(methods::as(rWGS84, "Raster"))
print(crrWGS84$area)
#### Plot 2 km2 raster created by changeRangeR
plot(crrWGS84$aooRaster)
## Add input raster of 1km2 (black lines)
vManhattan <- as.polygons(rWGS84)
plot(vManhattan, add = TRUE)
## Add original manhattan polygon
plot(mhWGS84, add = TRUE)