This is a brief introduction to the project that we worked on the Social Network Analysis course at the university of venice Ca' Foscari
The project is based on sentiment analysis of Twitter users and their opinions and behaviour towards environmental movements.
We came up with the idea of analysing the emotion and behaviour of users on a social media platform towards the end of the year 2022 when we witnessed countless environmental activists attacking paintings inside museums.
First we picked four specific incidents that happened in 4 different countries to work with which happened at the following museums:
- Louvre
- Uffizi Gallery
- National Gallery of Art
- Prado's Museum
Each event involves an environmental activist who was trying to convey their message through their actions by damaging pieces of art that were being displayed inside very famous museums.
We decided to collect all the needed data from twitter since it's a social media platform with an incredible amount of information.
SNScrape was used for data collection which is a scraper for social networking services (SNS). It scrapes things like user profiles, hashtags, or searches and returns the discovered items.
pip install SNScrape

import snscrape.modules.twitter as sntwitter
For the development verions
pip3 install git+https://github.com/JustAnotherArchivist/snscrape.git
With these tool we could retrieve data from any moment in time unlike the Twitter API V2.
After collecting the necessary data we decided to observe the users behaviour and their expressed emotions through various NLP algorithms such as TextBlob
( import TextBlob ) and Vader.
VADER( Valence Aware Dictionary for Sentiment Reasoning) is an NLTK module that provides sentiment scores based on the words used
#downloading the vader lexicon
nltk.download('vader_lexicon')

#importing the vader sentiment analyzer
from nltk.sentiment.vader import SentimentIntensityAnalyzer

#create a sentiment analyzer object
sent_analyzer = SentimentIntensityAnalyzer()
Both of the previous mentioned algorithms estimate the polarity and emotion expressed by a user through an analysis of the tweet text.
We decided to use the Vader algorithm since it is slightly more accurate than TextBlob.
For each event the data collected has been split into 2 periods, 15 days before the event and 15 days after, to get a rough estimate of people's opinion and also due to the Recency Bias it is unnecessary to get tweets that aren't close to the occurrence.
For every period there will be a sentiment analysis which will return the following graphs:
- Mention Networks (with gephi and networkx)
- MRE (Most Relevant Emotion per user)
- Histograms
- Networks
- Clustered Networks
- Etc...
Example of data visualization of a mention network with gephi:
The following network has been filtered and will show only the nodes that have degree > 5 to simplify the data visualization

After the data analysis process we also compared the MRE analysis of the period before and after to determine whether there have been changes in users opinions, for example here below we can observe the MRE bar chart that represents the most relevant emotions per user regarding the Louvre event followed by a pie chart that displays how many have actually changed their overall opinion after the incident occurred.
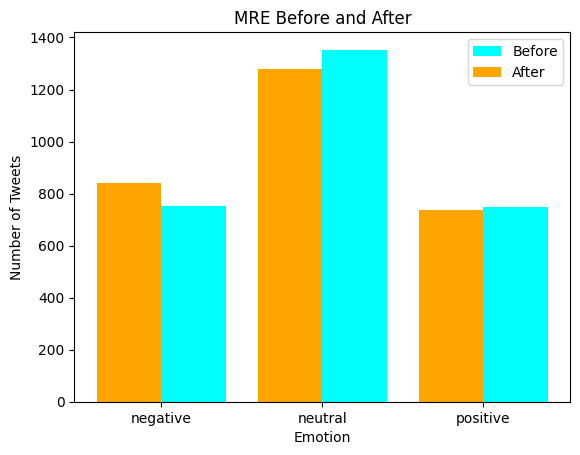
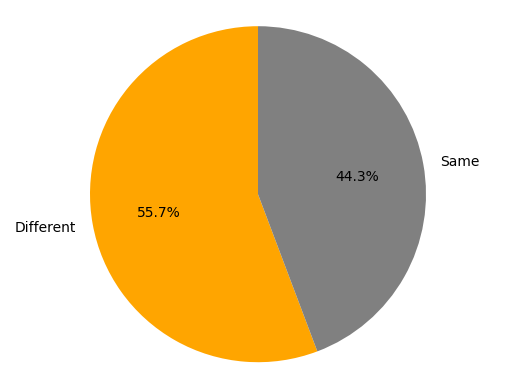
Disclaimer! : The MRE (Most Relevant Emotion) is a function that I manually created to determine a person's overall opinion on a topic, it might be unreliable and return faulty data.
- Were their actions really necessary to make people acknowledge the climate crisis?
- What did people really think of the protesters? Did they really change their mind?
- How did they react to the security systems of museums?
For more detailed information read the Report here.
This is a simple university project that might return faulty data due to data sparsity or wrong data collection and evaluation.