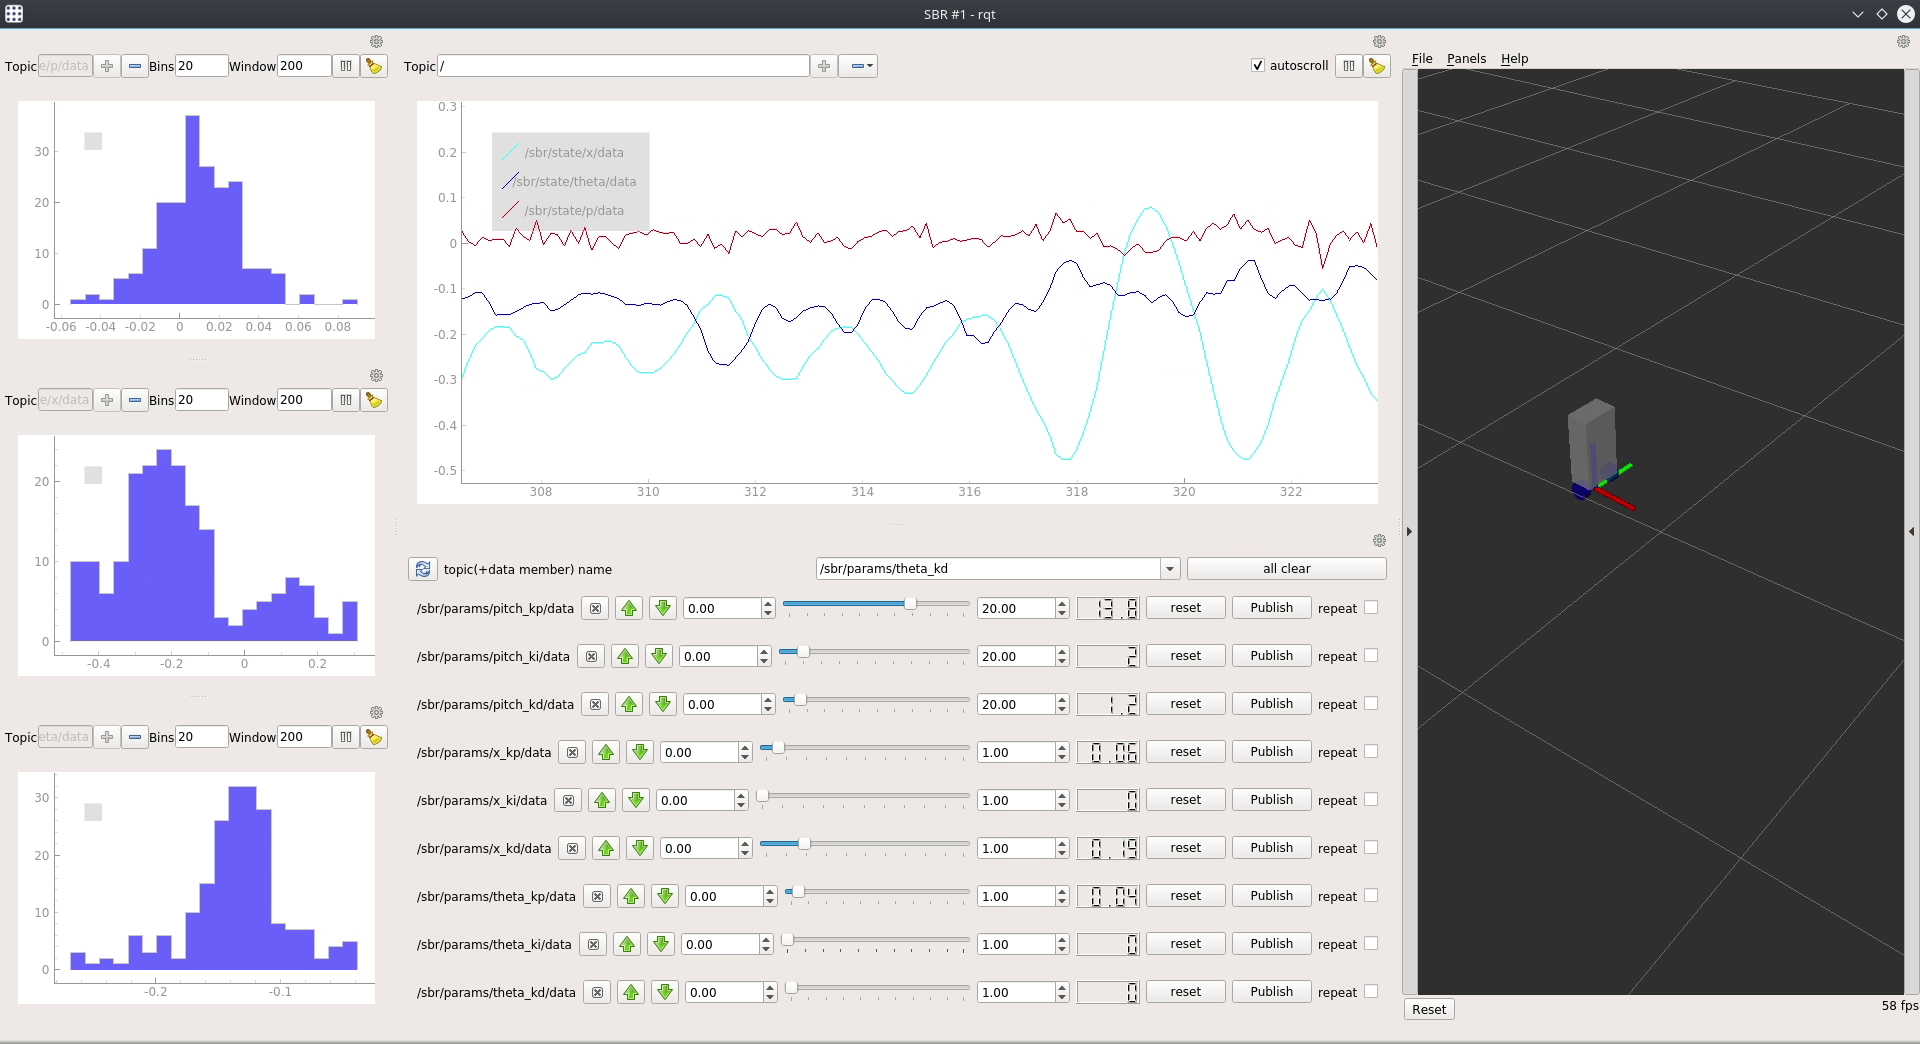
A fork of rqt_plot that presents the data as a histogram.
A screenshot from a real rqt project:
pyqtgraph>=0.10.0
Please, make sure you have installed pyqtgraph at version at least 0.10. Failing to do that may result in a segmentation fault.
cd ~/catkin_ws
source devel/setup.bash

# Installation
cd src
git clone https://github.com/protecto/rqt_histogram.git
cd ../

# Running
rqt --standalone rqt_histogram